Social Question

finkelitis's avatar

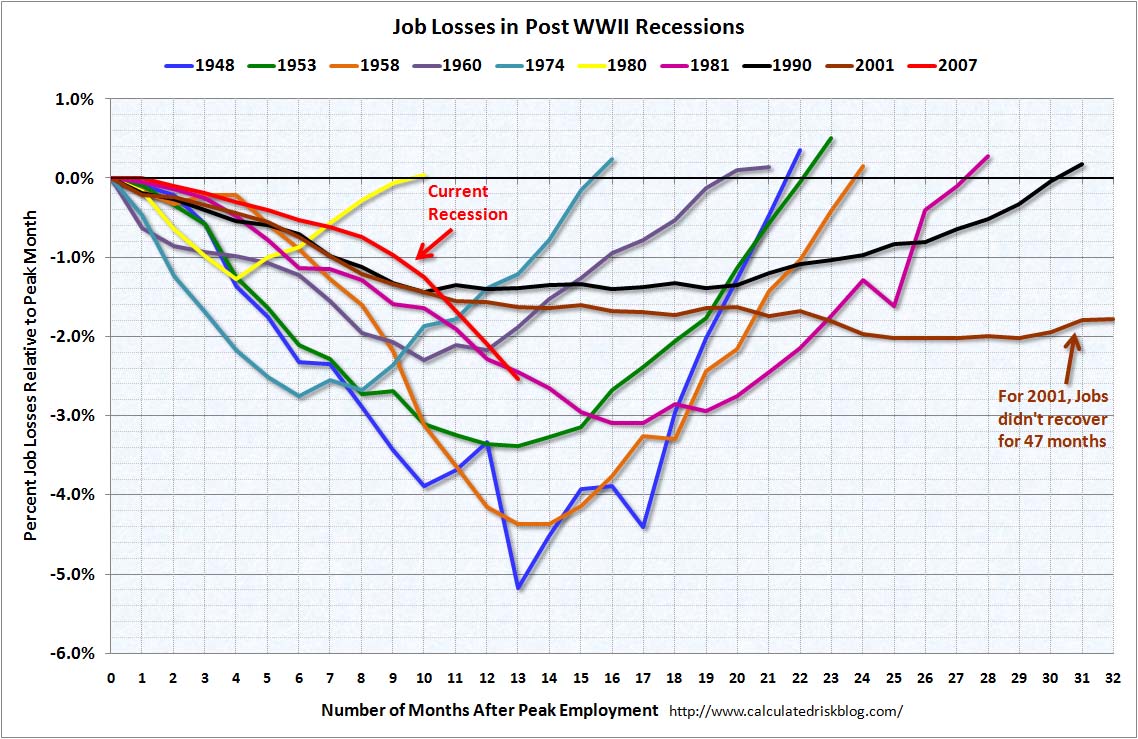
Do you find this graph convincing?

Asked by finkelitis (1907points) March 13th, 2010
27 responses
“Great Question” (3points)

The White House’s team recently released the graph at http://my.barackobama.com/page/content/recoveryanniversary/.
Personally, I find it to be a compelling display of data: clearly, the recovery act has helped staunch the bleeding, and job losses have slowed dramatically.

However, I wonder if my own politics influence me here. When you look at this graph, do you find it convincing, or do you feel like it’s misleading somehow? How do your personal political leanings affect how you read it?

Please mention in your answers where you align politically. I’m to the left of democratic party on most issues.

Observing members: 0
Composing members: 0

Answers

tarmar's avatar

facts be facts. unless you can find fault with the numbers they are using, it is what it is.

ArtiqueFox's avatar

No, I don’t find this graph 100% convincing. I haven’t seen these kind of progress in reality. Where I live, the local economy is neither moving up nor down.

Besides, the time period the graph measures is pretty darn short. Many of our past presidents’ plans have worked well in the short term, but caused damage later.

My conclusions on this graph or influenced by my opinions of Obama.

Where do I stand politically? I’m still deciding that. I’ll know by the time of the 2012 elections though.

nikipedia's avatar

I just took a political compass test to accurately gauge my views before answering. It looks like I am about as far left as Nelson Mandela or the Dalai Lama.

I also find the graph compelling. It cleanly and (I assume) accurately displays the data. There are no statistical tests being performed, so there’s nothing to interpret. I’m convinced.

SuperMouse's avatar

I do find it convincing, however my political leanings are very likely similar to yours.

CyanoticWasp's avatar

No, I don’t find it compelling. My views on American politics are pretty well known, I think, but I’ll state them again for clarity. I think both parties in our nominal “two-party” system lie and distort facts (and omit facts) to their advantage.

“Job loss” isn’t the whole story of our economy. I wonder how much those jobs “cost” in terms of the TARP and other various “stimulus” programs have added to our debt. (For the record, if I were a Republican I’d be ashamed of the job that Republicans have done in the Congress and in the White House while they were in power in those places; they sold out the traditional “conservative” Republican party—if there ever was such a thing—for their own political ends.) When inflation gets traction, which is a mathematical certainty, given time, then it will be interesting (and frightening) to see how that graph shoots into uncharted territory.

Both parties are more interested in accruing power to their respective “sides” and favored constituencies at the expense of the rest of the country and the Constitution, and they’ll say and do whatever they have to in order to achieve those ends. The truth is nowhere in there.

Fenris's avatar

There are tens of thousands of variables, all simultaneously interacting with each other on an economic, sociological, physical, and chaotic level just for starters that shape the course of events. I’m an iconoclast when it comes to macroeconomics because no numbers or simple correlations grasp even part of the big picture.

Also, you’re getting recovery facts from a government website. That’s like getting smoking safety information from tobacco lobbyists. So, not only is your bias clear (and I don’t use the word bias negatively, I’m only using it in the most neutral sense), it has shaped your opinion.

As for my opinion on the recovery – http://www.youtube.com/user/schiffreport?blend=3&ob=4#p/a/u/2/ISmttOnVnaI

BTW I’m unaffiliated with any party, but lean towards socialism/communism, so the failing of a conglomerate autocracy is unsurprising to me.

LuckyGuy's avatar

I find it convincing. Very well put. The other side of course would plot the data cumulatively and would show how job losses are still on the rise. The losses are slowing down and that must happen if we are going to turn this ship of a country around.
I am slightly left of center.

njnyjobs's avatar

Data used for this graph represents job losses per month over a certain amount of time. The fact is that there are fewer people employed who are eligible to lose their jobs as the periods rolled along – therefore smaller bars closer to Jan 2010.

This graph does not represent any Recovery that it is trying to illustrate. What is illustrated is a very simple way of distracting people with charts. They even made a play on the colors used and the intensity of the red bars as oppose to the softness of the blue bars.

What would be interesting to see is for this jobloss numbers pitted against employment and per capita income data.

nikipedia's avatar

I want to point out that nowhere does the graph claim anything about the economy as a whole. It is a graph documenting job loss and only job loss, clearly labeled at the x-axis and as the title of the graph (written across the bottom rather than the top).

laureth's avatar

Here’s a link to the Bureau of Labor Statistics data from that time period.

When I am thinking about how convincing something is, I like to fact check it rather than decide based on how I merely feel about it. I’m a fiscal moderate and a social liberal.

njnyjobs's avatar

@nikipedia so what do you think is the point of presenting the data the way it was presented?

I think it is a sly way of painting a false picture of the present state of the nation. The people behind this propaganda are desperately trying to create a sense of hope and success of the administration’s programs. Unfortunatley, a lot of people who don’t take the time to understand such propaganda are easily swept off their feet.

Dr_Lawrence's avatar

I am much more liberal than the US Democratic Party.

The data represented seem to be accurate and the graph is not misleading.

This graph represents the onset of a severe economic decline and the beginning of a reduction in the depth of the economic decline.

As long as the Republican refuse to support any initiatives from the President and the majorities in the House and Senate, the process of implementing positive changes will continue to be painfully slow.

With the 60 votes margin required in the Senate, the Republicans still cripple the Government even when legislation contains virtually all the concessions they have demanded. This has resulted in legislation that undershoots objectives and still gets held back due to block “No” voting by the GOP.

I hope there can be enough changes in the Senate in the mid-term elections to remove this damaging roadblock to real economic recovery.

nikipedia's avatar

@njnyjobs: The Republican party has been associated with the color red and the Democratic party with blue for a while now. This graph didn’t invent that.

I’ll make you a deal. If @laureth will dig up the statistics for total number of people employed for each month graphed there, I will plot job loss as a percentage of the workforce for each month and link to the graph. If there is another statistic you’d prefer to see I can do that instead, but I think that most accurately depicts what you’re getting at.

Fenris's avatar

I’d also like to see a graph correlating the particulars of the recovery with credit and borrowing usage. Also just how much the top predators on Wall St. made off of this whole debacle.

laureth's avatar

@nikipedia – at the time of this writing, the chart you wanted me to find is here. All kinds of info can be generated from this page.

finkelitis's avatar

@ArtiqueFox One point I’d like to make in response: the chart isn’t saying that things have gotten better—just that stopped getting worse (and had nothing been done, they probably would have continued getting worse, and more quickly).

One of the interesting things to me about data like this is it allows you to get a sense of what’s happening and what’s going to happen even when you can’t feel it yet in your own community.

liminal's avatar

It is not clear to me what I am supposed to get from this graph. I am not sure if I am thinking clearly either. The caption under the graph states this: “One year in, the evidence is clear – and growing by the day – that the Recovery Act is working…” I am not sure I buy this premise.

It would help me if the graph showed job growth and job loss. I am thinking that reduced job loss might be a given because there is nothing to lose. Yet, I am not sure my logic is clear here. Someone help me? I also wonder if I understand what is meant by job loss in this context.

I am also jaded to think organizations like to use graphs to affirm what they want me to think, without telling me so.

I like to think I am an independent who is frustrated with congress.

mrrich724's avatar

You learn in Stats 101 in college that you can use statistics to prove anything you want to prove ;)

finkelitis's avatar

@liminal I believe the graph shows the net job loss, meaning the difference between jobs created and jobs lost. In other words, if it’s at zero, for every job lost, a new job is created, so if my company goes out of business and lays off 10 employees, they’re hired by other companies that are doing expanded business (this is a very crude picture, but you get the idea).

I don’t think reduced job loss is a given—there’s plenty, plenty left to lose. But I think that the gain the administration is claiming is both from new job creation and from preventing old jobs from disappearing (both credited to the stimulus). It would give a fuller picture if they showed the difference between jobs lost and jobs gained.

I think that organizations definitely want the show you graphs to convince you of what they want you to think. On the other hand, that fact doesn’t mean that what they want you to think is untrue. That’s sort of my original question. Obviously the administration wants people to believe that the stimulus was successful. They’re presenting data to defend their case. I find it pretty compelling. Do you?

@mrrich724 that’s fine, but how do you actually see it happening in this case? When people manipulate data, there should be fingerprints on it. Show me.

mrrich724's avatar

You don’t have to manipulate data, you just use the data that proves your point. There aren’t going to be “fingerprints” as if something wrong were done.

There isn’t just one “right answer.”

Let’s talk a little chemistry, and in life, this statement can be seen everywhere: “For every action, there is an equal and opposite reaction”

You decide what point you want to prove, and you use the numbers that take you there.

And maybe I’m too apathetic to do it, but if you want to see “fingerprints,” I’m sure there are plenty of people out there that don’t think Obama is the reason for the season and have their own numbers to back it up.

john65pennington's avatar

This graph is like just any other graph. it was made to be compromised.

finkelitis's avatar

@mrrich724 You seem to be speaking in a very general way. I asked if this data was compelling to you. Your response seems to be that it’s not, and that there is no data that possibly could be convincing because whatever it was, it could have been selected to prove a person’s point. I find this to be a very cynical point of view. And I agree with you that data can be cherry picked, and that statistics can lie. It’s just that I’m asking a specific question about specific numbers. If you can’t go to data at some point, how do you expect to be able to differentiate good policy from bad policy?

I suppose the broader question I might have asked is, do you think that the stimulus was a success? But I didn’t do that because I thought the conversation would quickly devolve into people arguing from their political side. The more interesting question, to me at this moment, is, does this piece of evidence support that statement, and do your own political leanings affect how you view it? The responses here fall into three basic categories:

1. Yes, absolutely.
2. No, or possibly not, because the data is presented in some misleading fashion, or because the data isn’t that relevant anyway.
3. The whole project of looking at data is pointless.

I absolutely respect the first two responses. I find the third response pretty weak, because it doesn’t respect my question, and because it’s just wrong. There is a great history of people looking at data with an open mind and having their opinions changed. I would argue that that, above all else, is what should inform our opinions. We need to be vigilant about misleading statistics, of course, and I respect the person who says the fact that it comes from a political headquarters makes them mistrust it… but as we’ve seen, the numbers are backed up by the bureau of labor statistics (thanks @laureth). I was partly asking this question so that people who don’t think the stimulus was a success would be able to tell me how they respond to this data. Keeping track of actual information, actual numbers, allows us to have some basis for our opinions besides just gut instinct, which doesn’t leave a lot of room for discussion. And this is something I want to discuss. I’m ready to have my opinions changed—you just need to do it with facts and arguments.

Are these numbers relevant? People seem to look at job loss as a key indicator of economic recession (example). If you were trying to come up with a policy at the start of this recession, one of the things you might have tried to do is figure out a way to stop job loss (at a reasonable price—yours is a very relevant objection @CyanoticWasp). If this is what the results looked like, you might determine your policy a success.

I’m curious what your political leanings are @mrrich724. And yours, @john65pennington. Again, if you have responses to this question that go beyond “all data are lies,” I’d love to hear them.

@Fenris and @liminal: I totally agree that there’s a complexity problem here—it’s very hard to know how to interpret these things. I think my question partly comes from a desire to set a clear standard. What counts as success? Is this an indicator that we’re on our way? Again, I can imagine people saying, “If we could just lower those job loss numbers, that would be a sign we’re moving in the right direction.” So I guess a further question for you, @Fenris, is, how do you determine good policy if the system is so complicated that it’s essentially senseless?

I hope that the inclusion of this second graph gives a sense of how large the job losses are relative to the entire US job market. For example, @njnyjobs, I think it’s clear that there are still plenty of jobs to lose, based on the other chart, and that the bars don’t shrink simply because all the jobs to lose have been lost. Mathematically speaking, that would account for only 1–3% of the difference in size, a negligible variation, in this case.

liminal's avatar

@finkelitis Thank you for the explanation, it helps me understand. I agree, an organizations can want me to know things that are true. I like being careful, which reflects that I have a strong “wait, whoa, what?” bias underlying my political biases.

Your explanation combined with laureth’s data helps me, at the least, feel positive about having a new administration. I find it a compelling sign that we are moving in the right direction.

mrrich724's avatar

@finkelitis

sorry. To answer your question (and I didn’t look at the graph at any point), the data is not compelling to me just b/c I am a skeptic of what the Whitehouse says, regardless of who is in the presidency, so I do think your political preferences influence you if you use data provided by a group who you generally agree with. BUT, I do believe that the programs in place are helping.

My point was trying to say, “hey, don’t use what people give you to form an opinion b/c there will rarely ever be unskewed data. Rather formulate the opinion for yourself.”

But I apologize b/c I can see how that statement deviated from the question

I believe that the economy is on the up and that policies are working b/c I am an HR person, and for about half of last year, our interview room was FLOODED with everyone from people crying, to people actually fit for the job, to (mostly) people who were from completely different industries (or no industry at all, previously stay at home mom/dad)

Nowadays, that’s not happening which is leading me to believe that more people are hiring, there is more opportunity being presented, and that people are getting jobs.

So yes, I believe the programs are helping, but no, I don’t feel the data is compelling. And I don’t really have a particular political affiliation. My parents were diehard conservative, my University was leaning to the left, and I live in Los Angeles which is completely Liberal. I just tend to be a skeptic and look for the info myself. Did I vote for Obama? No. Do I think his people are doing a good job (re: the economic recovery), yes.

finkelitis's avatar

@mrrich724 Thanks for your perspective. I think I have a deeper attachment to data because I’ve seen how anecdotal evidence can lead people astray, and how data can lead people to see things they couldn’t see otherwise. (The Rand corporations study of the drug war led them to suggest a different policy than they went in personally assuming would work, for example, and even the tobacco companies studies showed smoking was harmful—they had to hide the data as a result). And it seems like there’s a political movement afoot these days that seeks to dismiss data in order to have the winner of debates go to the loudest (or most rhetorically convincing arguer) rather than the person who presents the best, most backed-up case. So it’s the romantic scientist in me, saying that opinions must be formulated with respect to data.

But I totally agree that there’s a danger using just the data that others present, and I appreciate your response.

@liminal Thanks for your last response too. I appreciate your impulse towards carefulness.

finkelitis's avatar

@Fenris I checked out the link you posted. I think there are some decent arguments there, and clearly we’re facing serious risks no matter what we do. Still, I think his emphasis on moral hazard is misplaced at the moment (though it’s certainly relevant—we just face more critical issues right now). I think we as a nation are in the position of having to swallow some bitter pills in order to stop economic catastrophe. It’s easy to find faults with some of the things that have had to happen (i.e., federally backing fannie and freddie). The question is, what is your best choice among bad choices?

As for his response to job numbers, I think he’s wrong not to care about job numbers being less bad than expected. You don’t get to go from losing thousands of jobs a month to magically gaining thousands of jobs the next month. There’s an inertia to large economic systems. So I view the fact of better than expected job numbers (even if they’re still negative) as a positive sign, since to move from job loss to job growth, the quickest way to go is by way of less job loss, to no job loss, to slight job growth to job growth. The fact that a year long journey isn’t over in a month doesn’t mean you aren’t going in the right direction.

laureth's avatar

I remember a time when opinion was considered biased and was best checked out by looking at facts. It makes me a little sad that facts are now becoming considered opinion in many circles.

Answer this question

Login

or

Join

to answer.

Mobile | Desktop


Send Feedback   

`